Solution: Nelson-Aalen estimator for Leukemia data
Eksempel
Here we solve problem 3.1 in ABG, using the definition in section 3.1.1 and the modifications needed to handle ties from section 3.1.3.
Solution
The Nelson-Aalen estimator for the cumulative hazard rate \(A(t) = \int_0^t \alpha(s)ds\) (\((3.4)\) in ABG) is given by \[\hat A(t) = \sum_{T_j \leq t} \frac{1}{Y(T_j)},\] where \(Y(t)\) is the number of individuals at risk just before time \(t\) and \(0 < T_1 < \ldots\) are the event times. Here we have ties, since the remission time is rounded to whole weeks. We therefore adjust the estimates using the correction \((3.12)\) in ABG, given by \[\hat A(t) = \sum_{T_j \leq t} \sum_{l=0}^{d_j}\frac{1}{Y(T_j)-l},\] where \(d_j\) is the number of events happening at time \(T_j\).
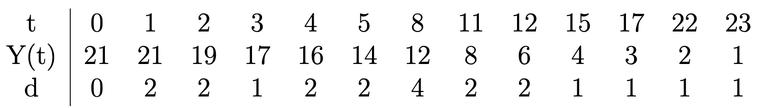
For the placebo group we have
For the 6-MP group we have

Note that the standard assumption is that the censored observations occur after the observed events for the same event time, and hence the formula can be used as stated above (if for example one assumed that the censoring happened first, the denominator in the inner sum would have to be reduced by the number of censored observations at that event time). Code 1 contains some R code that calculates and plots the Nelson-Aalen estimators for each case according to the formula stated above.
#P for placebo
#M is the 6-MP group

T_P = c(0,1,2,3,4,5,8,11,12,15,17,22,23) #Event times
d_P = c(0,2,2,1,2,2,4,2,2,1,1,1,1) #Number of events
c_P = rep(0,length(T_P)) #Censored observations

T_M = c(0,6,7,9,10,11,13,16,17,19,20,22,23,25,32,34,35)
d_M = c(0,3,1,0,1,0,1,1,0,0,0,1,1,0,0,0,0)
c_M = c(0,1,0,1,1,1,0,0,1,1,1,0,0,1,2,1,1)

Nelson_Aalen = function(Times,d,c){
  # Calculates the Nelson-Aalen estimate according to 3.12 in ABG
  m = length(Times)
  Y = rep(21,m)
  Y[2:m] = Y[2:m] - cumsum(d+c)[1:(m-1)]

  DeltahatA = rep(0,m)
  for (j in 2:m){
    # This is the adjusted inner sum
    if (d[j] > 0){
      for (l in 0:(d[j]-1)){
        DeltahatA[j] = DeltahatA[j] + 1/(Y[j]-l)
      }
    }
  }
  return(stepfun(Times[2:m],cumsum(DeltahatA))) #The outer sum is here
}

hatA_P = Nelson_Aalen(T_P,d_P,c_P)
hatA_M = Nelson_Aalen(T_M,d_M,c_M)


t = seq(0,40,by=0.01)

plot(t,hatA_P(t),type="l",col="blue",ylab="Nelson-Aalen estimate")
lines(t,hatA_M(t),col="red")
legend(0,3.5,c("Placebo","6-MP"),col=c("blue","red"),lty=1)
The resulting plot is shown in Figure 1. We observe that the patients treated with 6-MP had a smaller hazard rate of relapse than the patients in the placebo group.
