Solution: Leukemia treatment study (Exam 2021)
Eksempel
The Kaplan-Meyer estimates and corresponding confidence intervals may be found and plotted by the following R commands:
library(survival)
TPlacebo = c(1,1,2,2,3,4,4,5,5,8,8,8,8,11,11,12,12,15,17,22,23)
CensPlacebo = 1 - c(0,0,0,0,0,0,0,0,0,0,0,0,0,0,0,0,0,0,0,0,0)
T6MP = c(6,6,6,6,7,9,10,10,11,13,16,17,19,20,22,23,25,32,32,34,35)
Cens6MP = 1 - c(0,0,0,1,0,1,0,1,1,0,0,1,1,1,0,0,1,1,1,1,1)

KMPlacebo =  survfit(Surv(TPlacebo,CensPlacebo)~1, conf.type="log-log")
pdf("KMPlacebo.pdf")
plot(KMPlacebo,col="red")
graphics.off()

KM6MP = survfit(Surv(T6MP,Cens6MP)~1, conf.type="log-log")
pdf("KM6MP.pdf")
plot(KM6MP,col="blue",new=FALSE)
graphics.off()
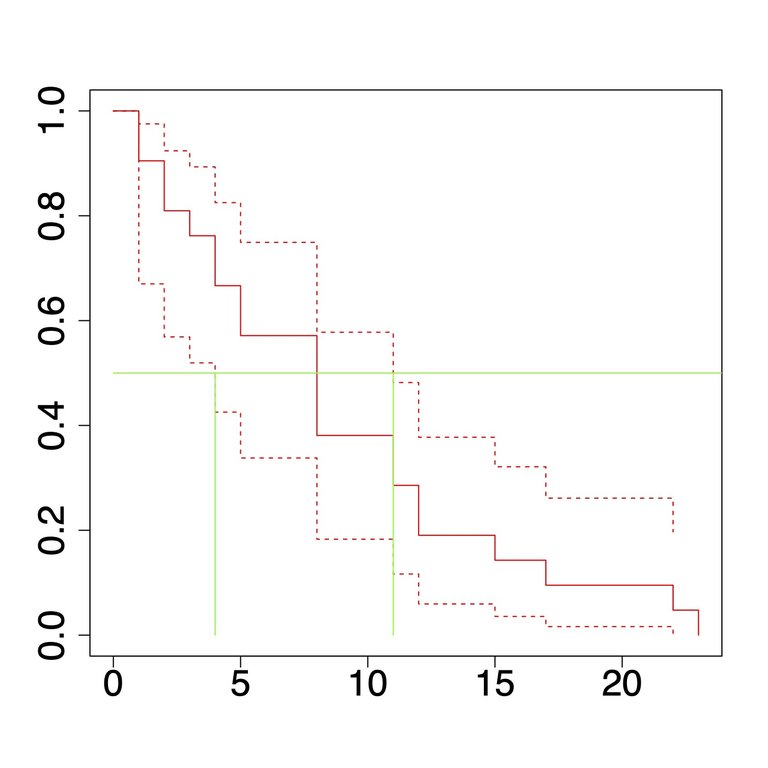
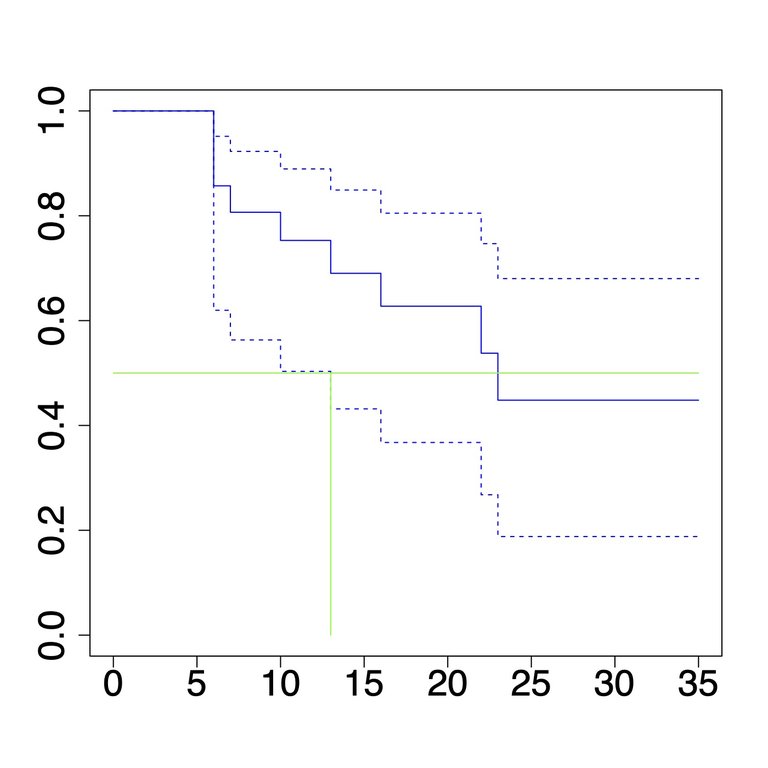
The resulting plots are shown in Figure 1 and 2.


Confidence intervals for the median survival times can be found by drawing a horisontal line at survival probability equal to \(0.5\) and reading off at which times \(t\) this line crosses the confidence interval curves. The process is illustrated by green lines in the two plots in Figure 1 and 2.
# For the placebo plot:
lines(c(0,25), c(0.5,0.5), col="green")
lines(c(4,4), c(0,0.5), col="green")
lines(c(11,11), c(0,0.5), col="green")

# For the 6MP plot:
lines(c(0,35),c(0.5,0.5),col="green")
lines(c(13,13),c(0,0.5),col="green")
Note that for the 6MP group the upper limit in the confidence interval is equal to infinity. The numerical values for the confidence intervals can either be read off from the plots or they can be found by inspecting the R variables KMPlacebo and KM6MP produced in the R code above, which can be done by the R commands below.
KMPlacebo
KM6MP
The confidence interval for the Placebo group becomes \(\underline{\underline{[4,11]}}\) and for the 6MP group it becomes \(\underline{\underline{[13,\infty)}}\).